

 Global



















AI-driven risk and anomaly detection
Surface what requires attention. Use machine learning and analytics to identify anomalies, changing trends, and relationships across access data that are difficult to recognize from isolated records.

Behavioral intelligence for insider risk
See when access behavior moves outside normal patterns. Analyze unusual access times, repeated restricted-area attempts, movement patterns, and deviations from historical or peer behavior for authorized review.

Intelligent Facility Security Scoring
Measure security posture at the facility level. Bring administrative controls, credential governance, alarm exposure, response performance, system health, and behavioral risk into a consistent security scorecard.

Unified security and operational intelligence
Bring security and facility insights into one analytical environment. Analyze risk alongside occupancy, footfall, visitor activity, attendance, and credential governance through focused AInsights analytics.

Automated analysis and reporting
Reduce time spent on manual security review. AInsights automates recurring site-level analysis and reporting, helping teams focus on better decision-making, corrective action, and continuous improvement.
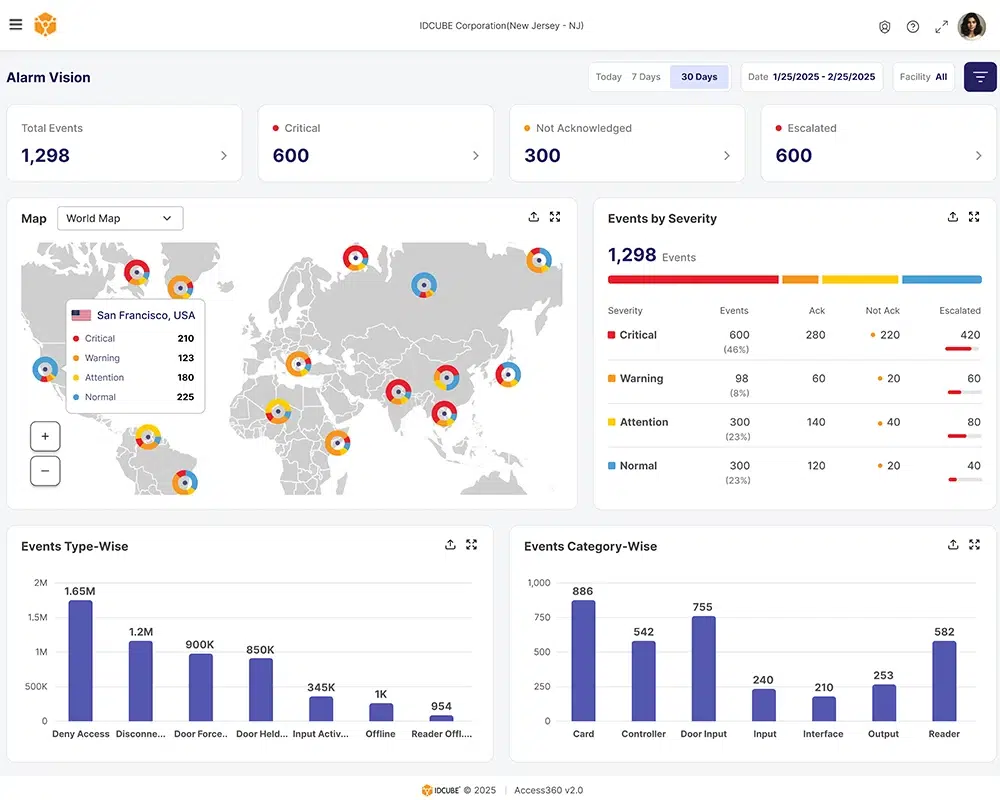
Alarm Vision
Bring critical alarm activity into focus. Analyze events by type, category, severity, acknowledgment, escalation, facility, and location. Filter and drill down to investigate what needs attention.
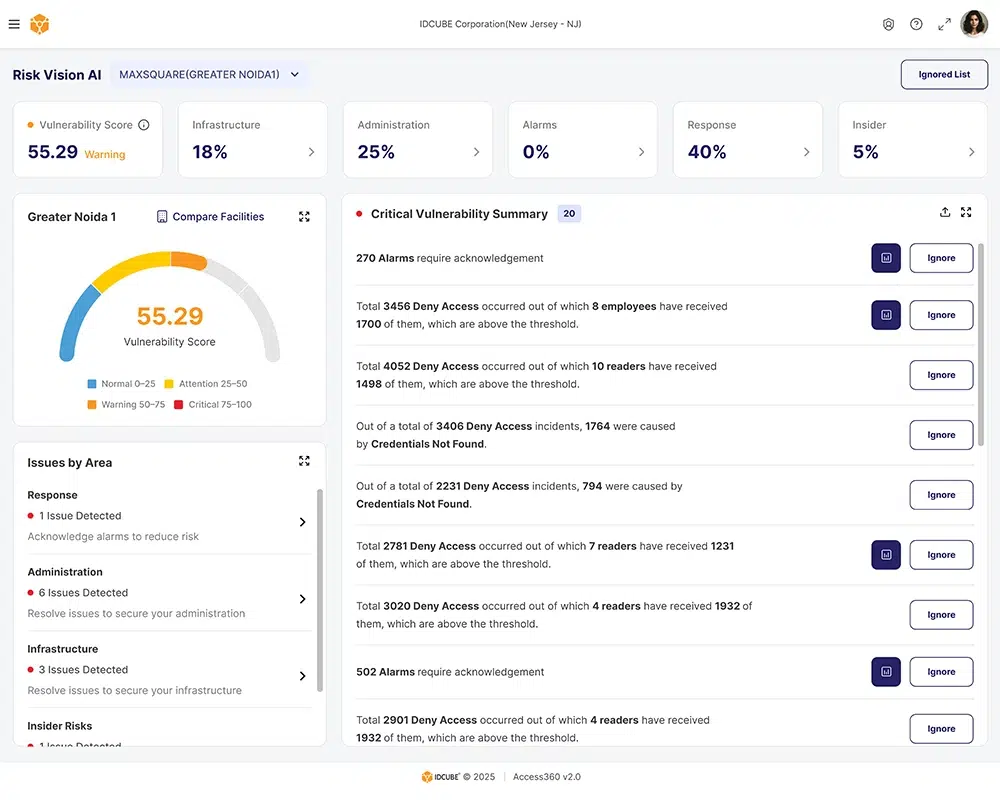
Risk Vision
Turn vulnerabilities into measurable risk. View facility vulnerability scores and compare locations. Investigate risks across infrastructure, administration, alarms, response, and insider activity.
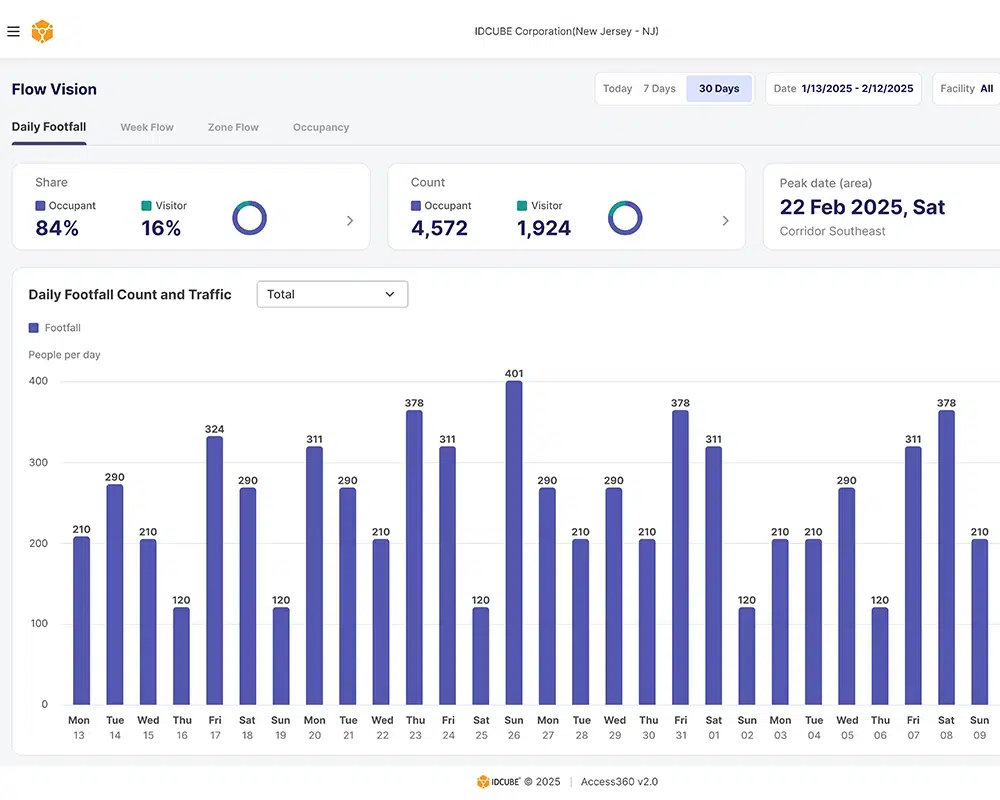
Flow Vision
Reveal how people move through your facilities. Analyze daily footfall, weekly peaks, zone-wise patterns, and occupancy to understand when and where spaces are being used.
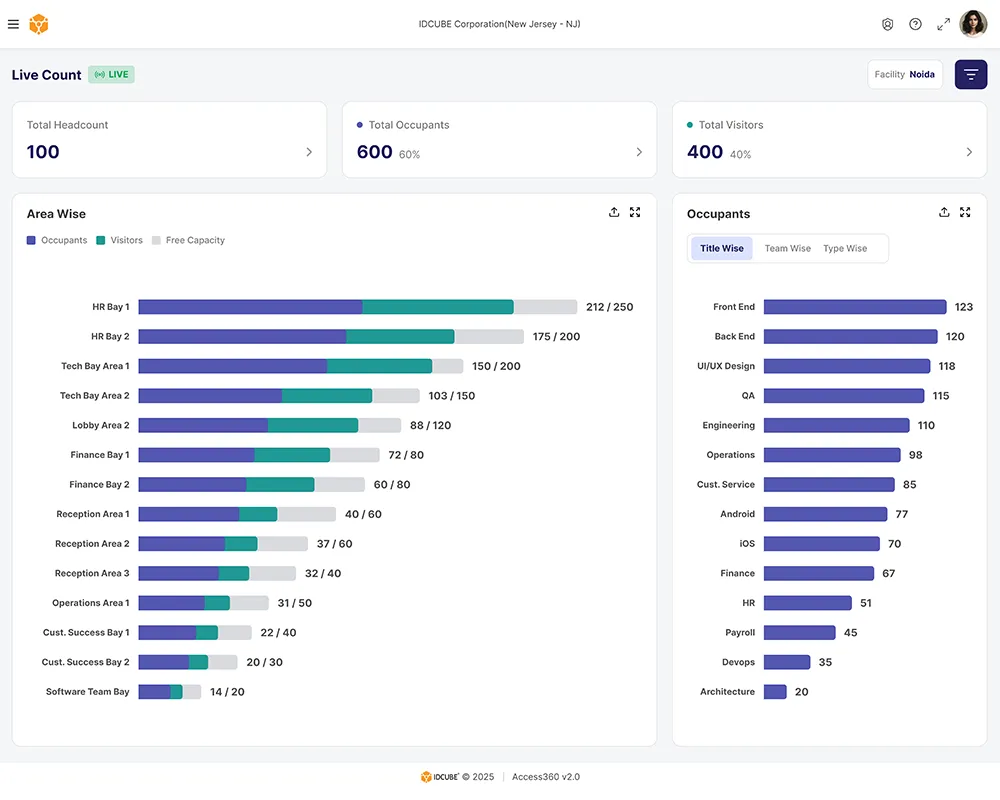
Live Count
Know who is on-site in real time. View headcount by area, team, title, user type, occupants, and visitors. Drill down when more detail is needed.
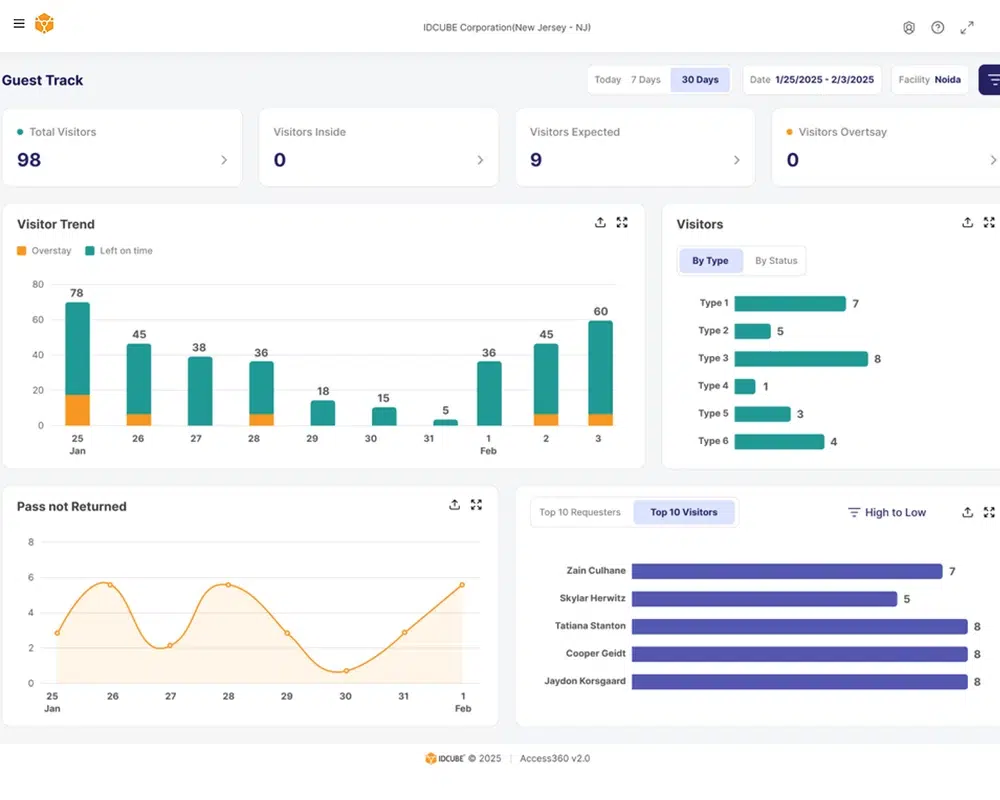
Guest Track
Spot visitor patterns that need attention. Track total, expected, and on-site visitors, overstays, unreturned passes, visit types, frequent visitors, and top requestors.
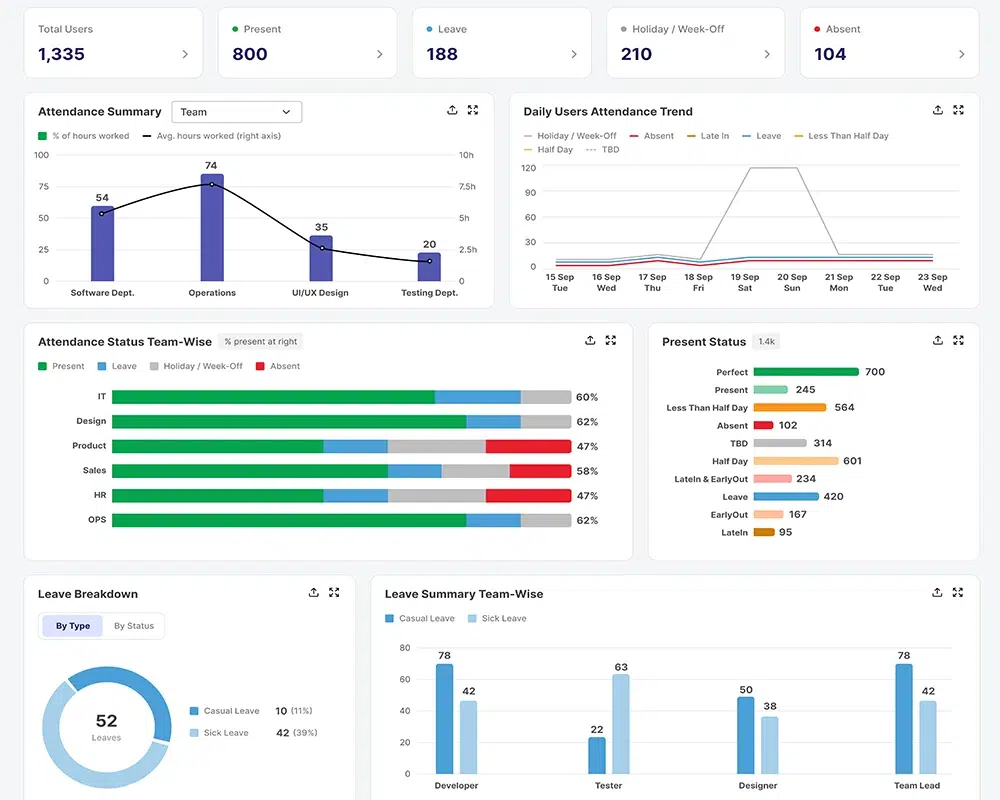
Chrono Vision
Turn attendance data into meaningful workforce trends. Review presence, absence, late-ins, early-outs, leave, team-wise attendance, and daily trends from one analytical view.
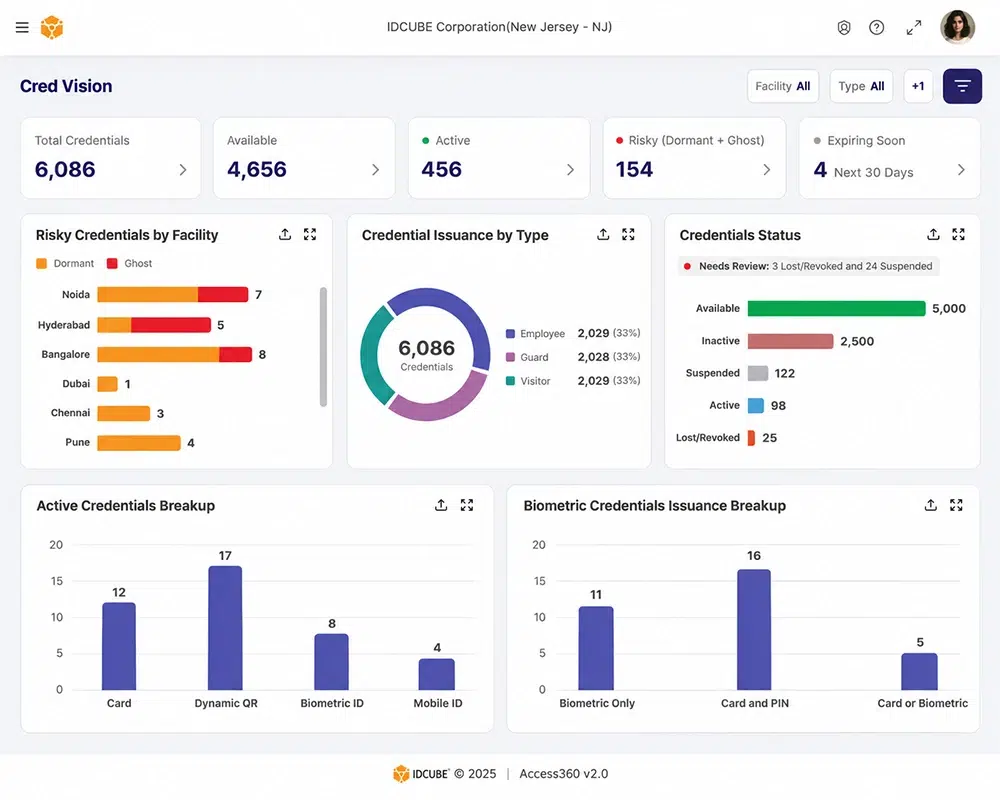
Cred Vision
Identify credentials that require attention. Track dormant and ghost credentials, credential status, issuance patterns, active credential types, biometric credentials, and upcoming expirations.
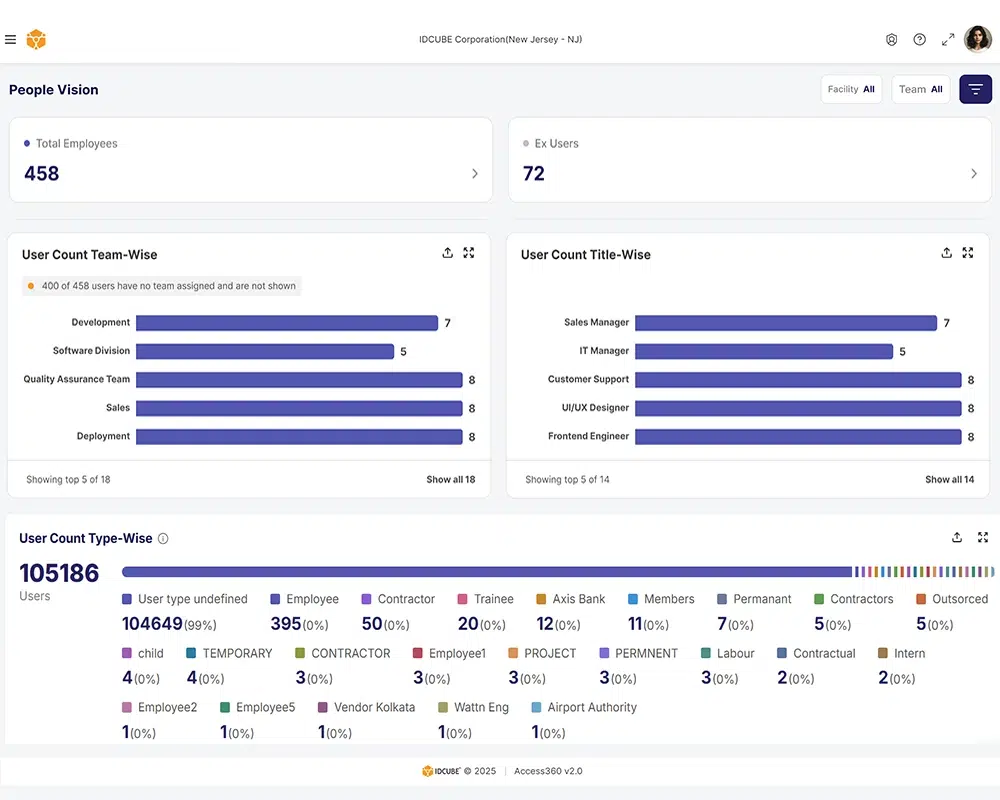
People Vision
Understand your registered user population clearly. Analyze users by team, type, and title. Maintain visibility into ex-users and personnel distribution across selected facilities.
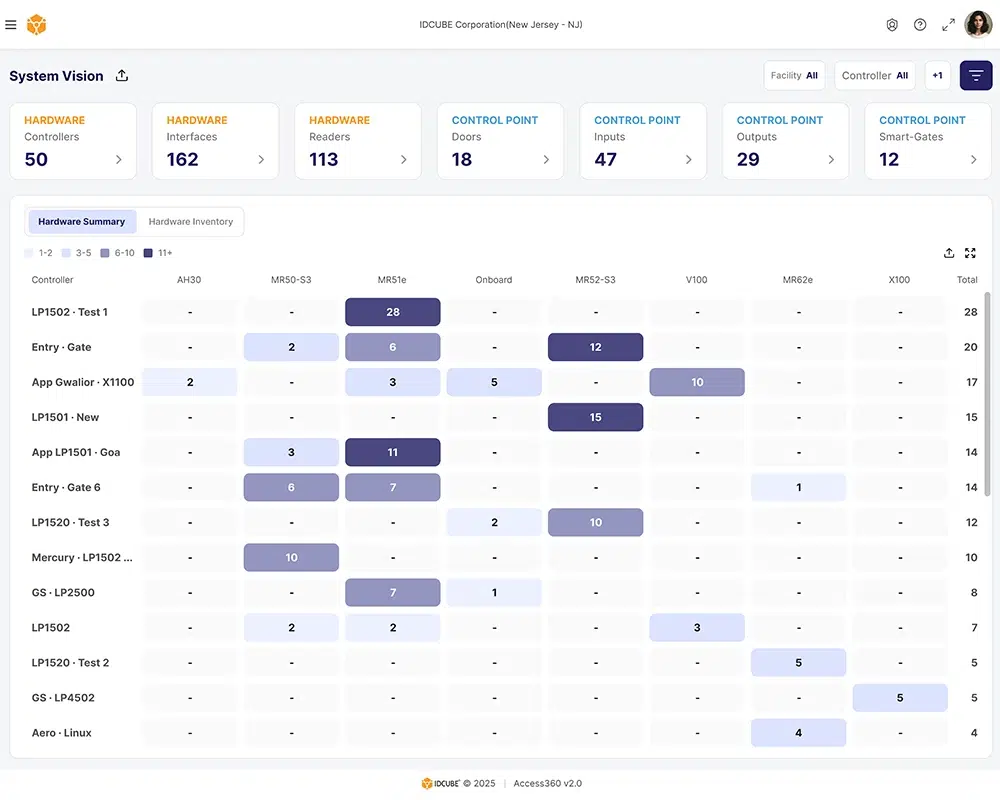
System Vision
Bring hardware and control points into one view. Monitor controllers, readers, inputs, outputs, doors, and gates. Use filters and drill-downs for more detailed infrastructure visibility.
How AInsights creates security intelligence
AInsights
01


Prepare the data
Organize access events, alarms, credentials, configurations, user attributes, and timestamps into a consistent analytical model for reliable analysis.
02

Establish context
Learn normal patterns across people, groups, facilities, zones, and time periods. This helps distinguish routine activity from behavior that deserves attention.
03

Detect what matters
Identify anomalies, recurring issues, changing trends, and relationships that are easy to miss when access records are reviewed individually.
04

Explain the finding
Show the supporting evidence, affected users or locations, trend direction, and priority behind each finding. This gives teams clearer context for investigation.
05

Act and learn
Connect insights to investigation and corrective action. Use feedback and changing conditions to improve future analysis and support continuous security improvement.

Confidence in Security Posture
Maintain stronger oversight of security conditions across facilities. Earlier visibility into anomalies, insider-risk indicators, vulnerabilities, and changing trends helps security teams prioritize investigation and corrective action.

Regulatory Compliance Assurance
Maintain clearer, more structured security records for internal reviews and audits. Centralized analytics and reporting improve visibility into incidents, access activity, and security performance while supporting ongoing compliance processes.

Enhanced Operational Efficiency
Turn occupancy, footfall, visitor, and workforce presence data into practical operational insight. Better visibility supports more informed decisions around space utilization, staffing, resource allocation, and facility operations.

Business Continuity
Recognize developing security issues earlier and investigate them with greater context. Faster identification and corrective action help organizations reduce avoidable disruption and maintain more resilient security operations.

Cost Savings
Reduce reliance on time-intensive manual analysis and recurring security reviews. Automated assessment and reporting improve team productivity, optimize security resources, and support better control of operational costs.

Healthy Workspace
Strengthen oversight of access behavior, credentials, visitors, and facility activity. Clearer security and operational intelligence helps organizations address irregularities, reinforce access policies, and maintain safer workplace environments.



Trusted by top leading industries









What do you like best about Access360?
Its intuitive and user-friendly interface combined with its comprehensive feature set. The clear separation between security configurations and HRMS-driven workflows makes administration well organized.
What do you dislike about Access360?
The platform is easy to use overall, but some of the advanced settings can take a little time to understand for new users. Adding more guided tutorials and in-app help would make the experience even better.
Recommendations to others considering Access360:
I would recommend Access360 to any organization looking for an easy-to-use access management solution. It combines access control, visitor management, identity management in one platform, attendance management making daily operations simpler.
What problems is Access360 solving and how is that benefiting you?
Access360 has helped streamline our physical access control and identity management processes by providing a centralized platform for managing users, credentials, visitors, and access policies along with Attendance Management systems.
Verified User in Information Technology and Services
Information Technology
★ ★ ★ ★

What do you like best about Access360?
One platform Hrview software
Nice platform to work
What do you dislike about Access360?
Sone time it will take the time to up due to technical issues
Recommendations to others considering Access360:
It is very vast software
What problems is Access360 solving and how is that benefiting you?
Arrange the best in time product service support
Kiran M.
Security Manager
★ ★ ★ ★ ★